A lot of time at work is spent with debugging code – mine, my colleagues’, and sometimes a third-party codebase.
During our latest developer book-reading club, a colleague mentioned py-spy for Python. It says “supports profiling all recent versions of the CPython interpreter (versions 2.3-2.7 and 3.3-3.7).” and you can attach it to an already running Python process.
One
sudo pip3 install py-spy
later, I was able to try it out on a random python program that runs on my Ubuntu by default.
sudo py-spy -p 1732 –flame flame.svg
I encountered flamegraphs (interactive svgs) earlier on when debugging spark code:
“Each rectangle represents a stack frame. The wider a frame is is, the more often it was present in the stacks. The top edge shows what is on-CPU, and beneath it is its ancestry. The colors are usually not significant, picked randomly to differentiate frames.”
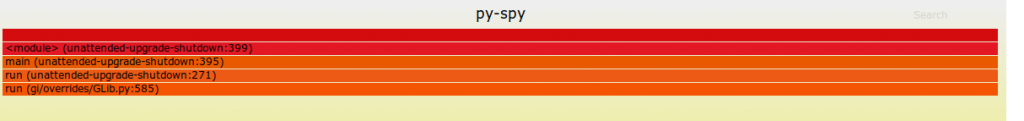
Nothing interesting to see here, but I’m sure it will come in handy when my work puts me on writing Python code again.